
Key Takeaways
- TrendAI™ Research found that 6,300 high-confidence industrial control systems (ICS) and building automation systems (BAS) devices were internet-accessible within 1 kilometer (0.62 miles) of 1,063 U.S. data centers, including BACnet controllers, Niagara platforms, and Vertiv/Liebert data-center equipment.
- These exposed devices bypass the Purdue Model's demilitarized zone (DMZ) entirely, creating direct internet-to-operational technology (OT) pathways to the physical systems controlling cooling, power, and environmental monitoring.
- AI-era data centers (2021 onwards) show a 13.1% exposure rate—more than double the 4.9% rate of pre-2010 facilities, suggesting there may be a correlation between speed of deployment and increased exposure.
- Known Common Vulnerabilities and Exposures (CVEs) with Common Vulnerability Scoring System (CVSS) scores up to 10.0 affect the specific software running on these exposed devices, and ICS-targeted malware such as FrostyGoop has directly targeted the Modbus protocol; we found Modbus was used by 159 of the exposed devices.
When we think about security for data centers, our minds typically go to firewalls, intrusion detection systems, distributed denial of service (DDoS) mitigation, and zero-trust architectures. We imagine racks of servers humming behind layers of sophisticated cyber defenses. However, there’s another side to these facilities that rarely makes it into security conversations: the physical infrastructure that keeps everything running.
Data centers are, at their core, climate-controlled warehouses for computing equipment. They require precise temperature control, humidity management, power distribution, and backup systems. Loss of cooling margin can quickly cascade into thermal alarms and automated protective shutdowns. A power fluctuation can corrupt data. These functions are managed by industrial control systems (ICS), building automation systems (BAS), and supervisory control and data acquisition (SCADA) systems—the same technologies that run power plants, water treatment facilities, and manufacturing floors. What happens when these systems, designed for operational efficiency rather than security, become accessible from the internet? Rising artificial intelligence (AI) infrastructure demands, construction disputes, and geopolitical tensions are elevating the risk of hacktivism and targeted attacks against data centers.
Our scan of ICS protocols within 1 kilometer (0.62 miles) of over 1,000 U.S. data-center GPS coordinates identified 6,300 verified devices—real building automation controllers, HVAC systems, and power management interfaces on the public internet. This scan involved no exploitation and no active probing beyond Shodan’s passive scanning. For safety and ethical reasons, we did not probe any device ports directly. The exposure rate is higher for newer facilities: Data centers permitted since 2021 are more than twice as likely to have nearby ICS exposure compared to pre-2010 facilities. BACnet and Fox/Niagara protocols account for 81% of findings, and 143 multi-protocol gateway devices represent high-value targets that bridge multiple building systems. The security implications section details how these exposures map to concrete attack scenarios, including operational disruption, ICS ransomware, and lateral movement.
The infrastructure gold rush
The AI boom has ignited a wave of data-center construction across the U.S. In 2025 alone, private companies poured an estimated US$300 billion into AI infrastructure, with construction spending reaching roughly US$3.5 billion monthly, according to the U.S. Census Bureau. Hyperscalers like Amazon, Microsoft, Google, and Meta are racing to build the compute capacity their AI ambitions demand.
The scale and speed of this expansion are transforming communities. In Ashburn, Virginia—known as “Data Center Alley”—152 data centers now operate across just 15 square miles, with more under construction. An estimated 70% of internet IP traffic is either created or passes through this suburban enclave. In rural Indiana, Amazon transformed 1,200 acres of farmland into a US$11 billion facility "almost overnight.” Meta’s US$10 billion Hyperion facility in Louisiana spans more than 2,000 acres.
However, this infrastructure gold rush is meeting resistance. Families in northern Virginia now live adjacent to massive construction sites. Local politicians who once courted data-center investment are running campaigns to slow expansion. Residents cite quality-of-life issues, noise, traffic, and electricity bills projected to rise by 8% to 25% in high-demand markets as data centers strain power grids. In the PJM Interconnection electricity market (the regional grid operator) stretching from Illinois to North Carolina, data centers accounted for a US$9.3 billion price increase in the 2025 to 2026 capacity market alone.
This matters for our research because speed often sacrifices security. When facilities are being built at unprecedented pace to meet AI compute demand, the building automation systems that manage cooling, power, and environmental controls may not receive the same security scrutiny as the servers they support. The pressure to bring capacity online quickly creates opportunities for misconfigurations, default credentials, and direct internet exposure of operational technology. The faster the boom, the larger the invisible attack surface.
The research question
The question we set out to answer was simple: How many ICS/BAS/SCADA devices are internet-accessible within close proximity to major U.S. data centers?
Using Shodan, a publicly available search engine for internet-connected devices, we conducted a systematic scan of ICS protocols around the geographic coordinates of over 1,000 U.S. data centers. While we used Shodan for this research, similar analyses could be performed using other platforms such as Censys, or by scanning your own IP address space with ICS-specific Nmap scripts and correlating results with GeoIP services. The methodology was straightforward: Query Shodan for devices running industrial protocols within a 1-kilometer (0.62-mile) radius of each data center's GPS coordinates, then apply rigorous filtering to separate real operational technology (OT) from the noise of honeypots, misconfigurations, and false positives.
IP addresses were geolocated using Shodan’s GeoIP metadata, which maps IP address ranges to approximate latitude/longitude based on internet service provider (ISP) registration records, rather than precise device locations. While this approach provides reliable regional clustering, it can map many devices to the same coordinates and should be interpreted as proximity within a metropolitan area, not the exact physical location.
Sourcing the data-center locations
For this research, we first needed a catalog of vetted U.S. locations of data centers with precise GPS coordinates. We sourced this from a Business Insider investigation that mapped over 1,240 data centers across the U.S. The dataset, compiled for their reporting on the AI-driven data-center boom, included facility addresses, operator names, and geographic coordinates derived from public records, environmental permits, and utility filings.
We extracted the structured data from the article's interactive map component, which contained facility records with fields for location, ownership, and operational metadata. After cleaning and deduplicating, we were left with more than 1,000 unique locations with verified latitude/longitude coordinates suitable for querying using Shodan's geo-proximity queries.
This approach has an important implication: the data centers in our research skew toward larger, publicly documented facilities—the kind that appear in environmental impact reports and utility planning documents. Smaller, private data centers that fly under the regulatory radar aren't represented. This means our findings represent a lower bound on the true extent of ICS exposure near U.S. data-center infrastructure.
The numbers tell a story
From the Shodan scan data, we made the following observations:
- 73,847 raw Shodan records from ICS-specific protocol scans
- 14,510 unique device-port combinations after initial filtering and deduplication
- 8,458 unique IP addresses responding on ICS protocols
- 6,300 high-confidence ICS devices (43.4% of filtered results), representing 3,991 unique IP addresses, after applying our confidence scoring
- 1,063 data centers in the research catalog
Those 6,300 high-confidence devices are not theoretical—they are real building automation controllers, HVAC systems, power management interfaces, and programmable logic controllers that someone, somewhere, put on the public internet. Many of them respond with detailed banner information, such as vendor names, firmware versions, zone configurations, and equipment inventories. Taken together, these devices are treasure troves of actionable information for threat actors.
A quick primer: What are these systems?
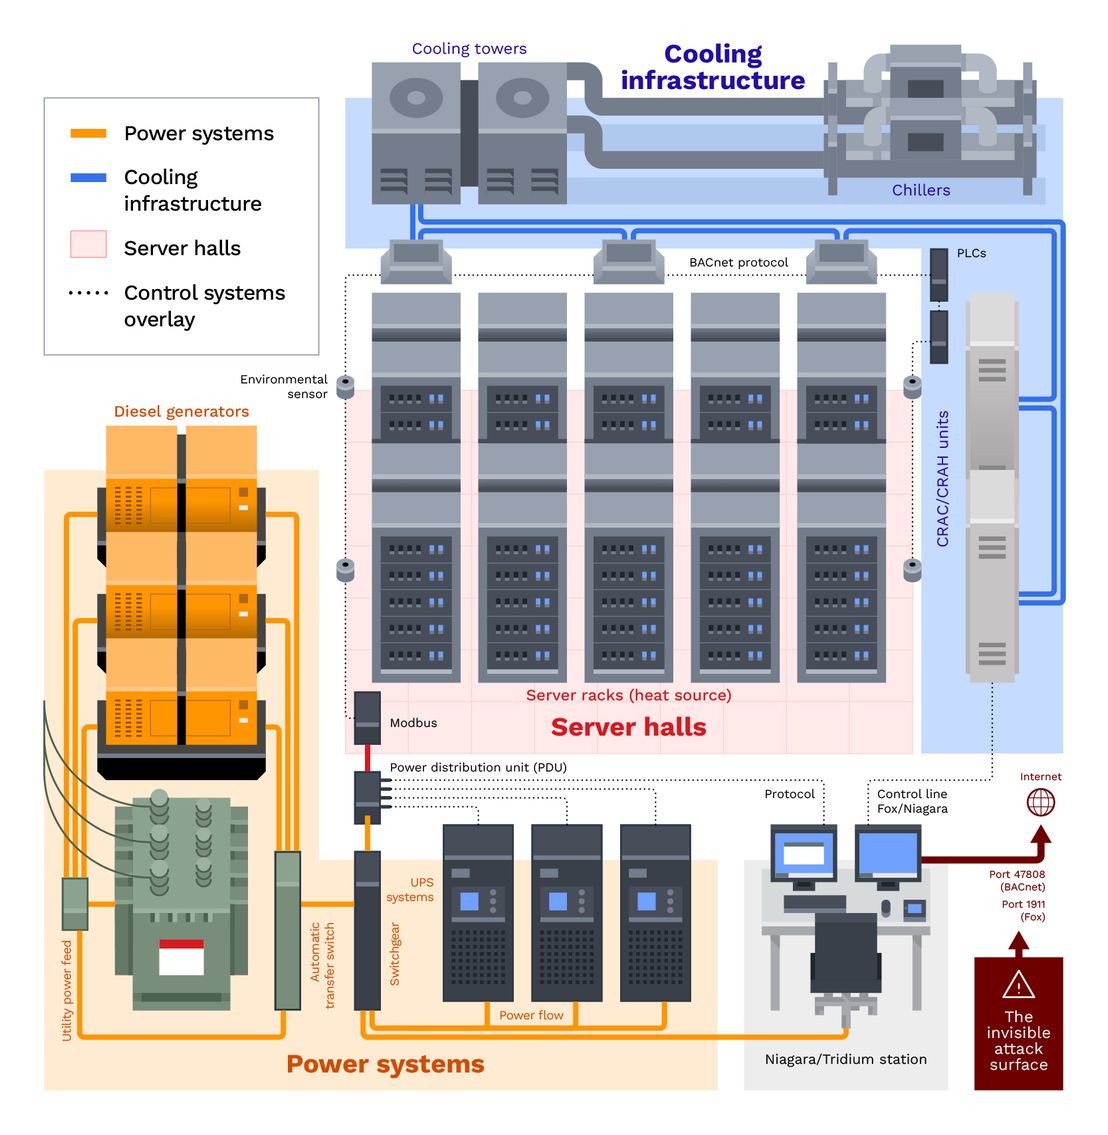
To provide context for what follows, let us first explore what these devices do and why they matter. If the reader is familiar with data centers but not industrial controls, this section provides the necessary context. Figure 1 illustrates how these systems integrate within a typical data center’s environment, showing the relationship between power infrastructure, cooling systems, server halls, and the building automation controllers that tie everything together:
Building automation systems (BAS)
Building automation systems control the “comfort” systems in buildings, such as heating, ventilation, air conditioning (HVAC), lighting, access control, and fire alarm monitoring. In data centers, they are critical—servers generate enormous heat, and if cooling fails, equipment can overheat within minutes. BAS typically use the BACnet protocol (port 47808), which was developed in the late 1980s (standardized as ASHRAE 135 in 1995) for interoperability, not security. When querying a BACnet device, it often responds with a wealth of information, such as vendor IDs, device names like "AHU-ROOF-02" or "Chiller Plant B," firmware versions, and object lists describing every sensor and actuator in the system.
Industrial control systems (ICS)
ICS is a broader category that includes programmable logic controllers (PLCs), remote terminal units (RTUs), and human-machine interfaces (HMIs). In the context of data centers, these often control power distribution, generator switchover, and uninterruptible power supply (UPS) management. Common protocols include Modbus (port 502), EtherNet/IP (TCP/UDP port 44818), and Siemens S7 (TCP port 102, also known as ISO-TSAP, which is shared by other protocols such as ICCP). These protocols date from the late 1970s onward and assume a trusted network environment; authentication and encryption were afterthoughts, if considered at all.
Supervisory control and data acquisition systems (SCADA)
SCADA systems provide supervisory control over distributed infrastructure. In utility contexts, they manage power grids and water systems. In data centers, they oversee campus-wide power distribution or cooling plant operations. The DNP3 protocol (TCP port 20000) is a telltale sign of SCADA infrastructure in North America (European SCADA systems more commonly use IEC 60870-5-104), though this port has a high false-positive rate due to Transport Layer Security (TLS) servers and virtual private network (VPN) endpoints that also use it.
Niagara/Fox protocol
One of the most common findings in this research was devices running the Fox protocol (port 1911), which indicates Tridium Niagara Framework. Niagara, now owned by Honeywell, is a Java-based middleware platform that integrates various building systems into a single management interface. It's popular in commercial buildings and data centers because it can unify disparate vendor equipment under one dashboard.
The problem is that many Niagara installations were deployed before cybersecurity was a concern, and they often retain default credentials or lack encryption. Recent security research demonstrates these concerns: in 2024, researchers at Nozomi Networks uncovered 13 new vulnerabilities in the Tridium Niagara Framework, including argument injection flaws and cryptographic weaknesses that could allow attackers to bypass security controls on misconfigured systems. The FBI has warned that the Fox protocol on port 1911 discloses system information without authentication. A Niagara device on the internet is essentially a gateway to an entire building's automation infrastructure.
Separating signal from noise: The filtering deep-dive
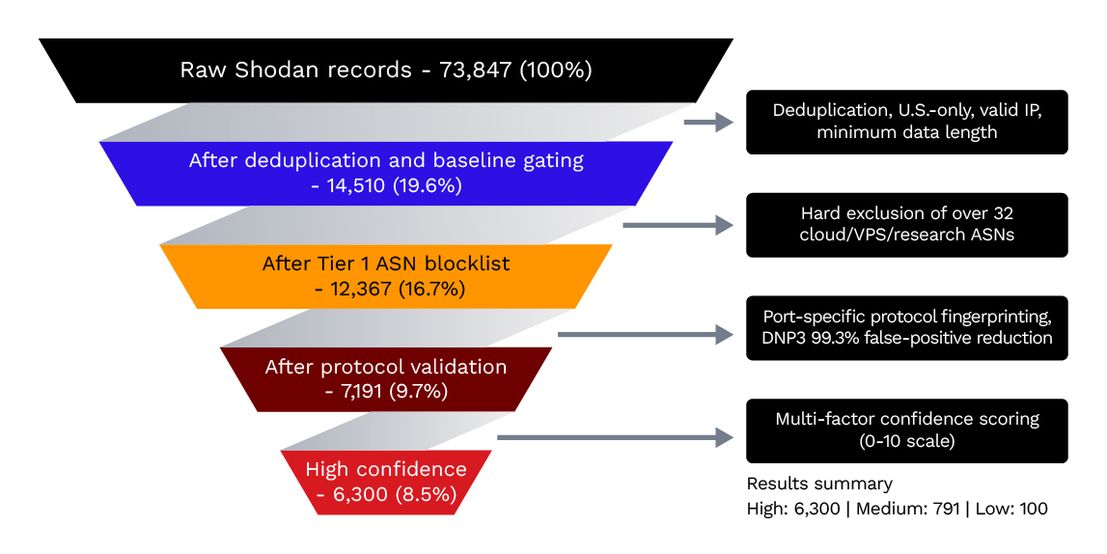
Anyone who has worked with Shodan data knows that raw results can be cumbersome. The 73,847 initial records included honeypots designed to attract attackers, misconfigured web servers, security researchers' test systems, cloud-hosted scanning infrastructure, and legitimate industrial devices all mixed together. The challenge was developing a methodology to distinguish real operational technology from everything else. You will find a detailed analysis of our Shodan data filtering methodology in Appendix B.
What we found: Protocol and vendor analysis
The protocol distribution in Table 1 reveals what kinds of systems are exposed and what they control. These seven protocol-query categories account for 5,951 of the 6,300 high-confidence devices; the remaining 349 were identified through vendor-specific queries (such as Delta, Trane, Distech, and Vertiv/Liebert) and are summarized in Table 2.
| Protocol | Number of high-confidence ICS devices | What it controls |
|---|---|---|
| BACnet (47808) | 3,664 (58%) | HVAC, lighting, access control, fire systems |
| Fox/Niagara (1911) | 1,453 (23%) | Integrated building management platforms |
| EtherNet/IP (44818) | 402 (6%) | Industrial PLCs, assembly automation |
| S7/IEC 61850 (102) | 259 (4%) | Substation automation, power systems (98% IEC 61850) |
| Modbus (502) | 159 (3%) | Power meters, RTUs, industrial devices |
| OPC-UA (4840) | 10 (<1%) | Modern industrial communication |
| DNP3 (20000) | 4 (<1%) | SCADA, utility infrastructure |
The dominance of BACnet (58%) and Fox/Niagara (23%) confirms that building automation, not heavy industrial process control, is the primary exposure vector near data centers. These protocols manage the cooling, power conditioning, and environmental controls that data centers depend on for continuous operation.
Vendor landscape
Banner analysis reveals the manufacturers behind these exposed devices:
| Vendor | Count | Significance |
|---|---|---|
| Niagara/Tridium (Honeywell) | 1,785 (28%) | Building integration platform |
| Delta Controls | 237 | Commercial HVAC, BAS controllers |
| Automated Logic (Carrier) | 124 | WebCTRL platform, BAS |
| Carrier | 123 | i-Vu system, HVAC |
| Trane | 102 | Tracer SC/Summit, chillers |
| Distech Controls (Acuity) | 101 | EC-Net, building automation |
| Schneider Electric | 28 | EcoStruxure, power management |
| Vertiv/Liebert | 16 | Precision cooling, UPS, PDUs |
The dominance of Niagara/Tridium (28%) is interesting but not surprising. Niagara was designed as an "IoT platform" for building integration before the Internet of Things (IoT) was a term, and before security was a serious consideration. Many installations date from 2005 to 2015 and could retain default credentials or use weak authentication.
The presence of Vertiv and Liebert devices is particularly relevant for data centers. These vendors specialize in precision cooling (CRAC/CRAH units), UPS systems, and power distribution units—the mission-critical infrastructure that keeps servers running. Finding them internet-accessible suggests that core data-center systems, not just adjacent commercial buildings, may be more exposed than operators realize.
What the banners reveal: Anonymized examples
To illustrate what exposure looks like in practice, here are anonymized examples from our dataset. IP addresses and identifying details have been redacted, but the device types and organizational context are preserved:
Example 1: Liebert power management. In one major metro area, we found two Liebert power management units (port 47808) registered to a business ISP, located 0.45 kilometers (0.28 miles) from a documented data center. Liebert specializes in UPS and power distribution equipment specifically designed for data-center environments. These devices were tagged by Shodan as verified ICS and returned detailed banner information.
Example 2: Multi-protocol exposure. A single IP address in a major data-center corridor responded on both Modbus (port 502) and BACnet (port 47808). This pattern suggests an integrated building management system with both industrial protocol (likely for power metering) and building automation (HVAC control) on the same controller. This is a gateway device; compromising it grants access to multiple building systems.
Example 3: Educational institution overlap. A major university network showed Modbus devices within 0.5 kilometers (0.31 miles) of commercial data centers. Universities often have sophisticated research computing infrastructure adjacent to commercial facilities. Their building automation, while not part of the commercial data center, could affect shared utilities or create pivot points for attackers.
Example 4: The Trane Tracer cluster. We identified multiple Trane Tracer SC devices (a commercial HVAC control platform) across several unrelated organizations within the same geographic area. Each was registered to a different ISP, but all were near the same data center. This pattern suggests either shared HVAC infrastructure or a common system integrator who deployed similar configurations across multiple clients.
These examples illustrate a pattern: the devices are real, the exposure is intentional (for remote access), and the information disclosed is operationally useful to an attacker.
Geographic patterns: Where exposure clusters
The geographic distribution of exposed devices maps closely to major U.S. data-center markets:
| Metro area | High confidence | Notable pattern |
|---|---|---|
| Silicon Valley | 1,020 | San Jose (590) and Santa Clara (430) |
| New York Metro | 1,285 | New York City and Newark corridor |
| Los Angeles | 403 | Downtown and El Segundo clusters |
| Phoenix | 398 | Emerging hyperscale market |
| Baltimore/DC | 363 | Government/contractor proximity |
| Miami | 324 | LATAM connectivity hub |
| San Diego | 286 | Defense/biotech concentration |
| St. Louis | 276 | Central U.S. fiber hub |
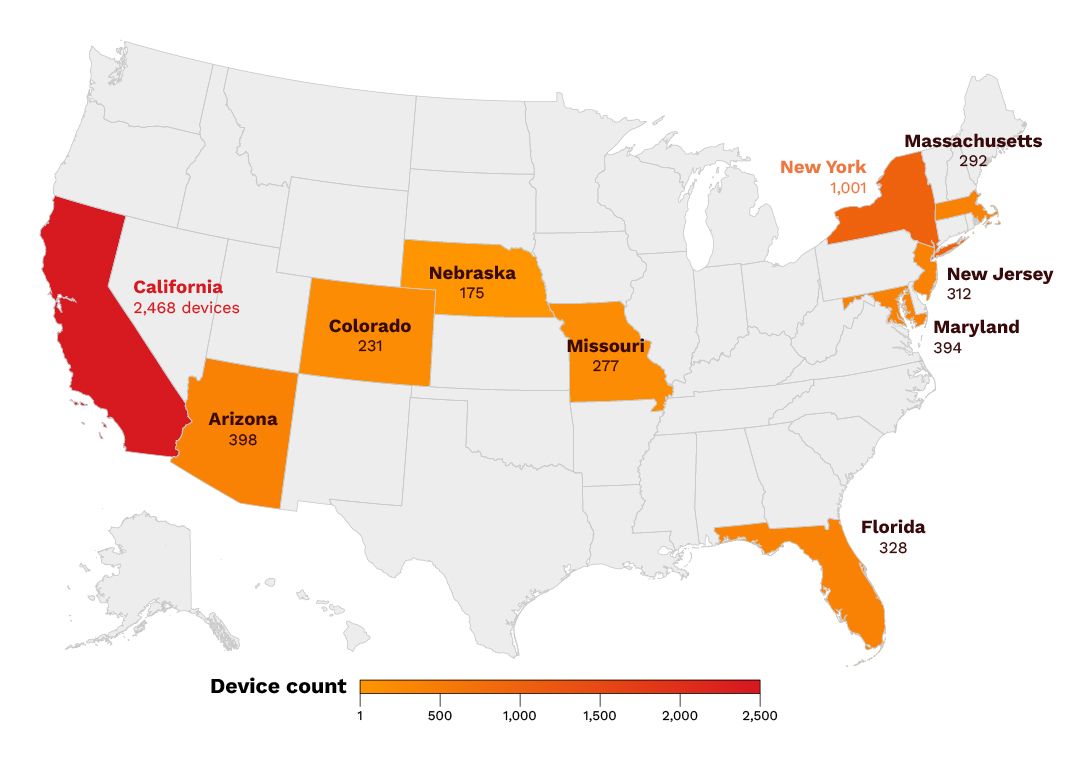
California alone accounts for 2,468 high-confidence devices (39% of total), reflecting Silicon Valley's concentration of data centers. The New York metro area (New York City and Newark) accounts for 1,285 devices. These are not random distributions; they correlate strongly with known data-center density.
Geographicsuper-clustering: At 0.01-degree precision (roughly 1 kilometer, or 0.62 miles), our 6,300 devices cluster into just 82 unique geographic locations. The largest single cluster contains 925 devices at identical coordinates. This reflects how ISPs register IP address blocks to central locations, meaning dozens of organizations’ building automation may route through shared network infrastructure in a single area.
Visual evidence: The clustering effect
Figures 4 and 5 show exposed device clustering around data centers. It is important to note the caveat on geolocation: many IP addresses map to identical coordinates because ISPs assign location data at the regional level, not the device level. When we see over 300 devices at the same coordinates, that is the ISP’s registered location for that IP address block, which typically corresponds to a commercial or industrial district where data centers cluster.
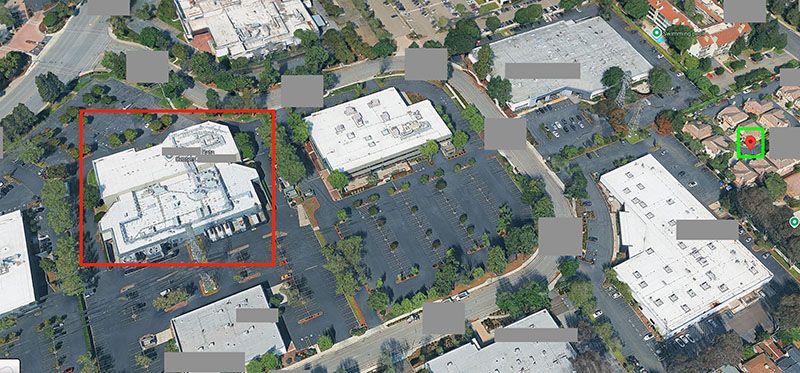
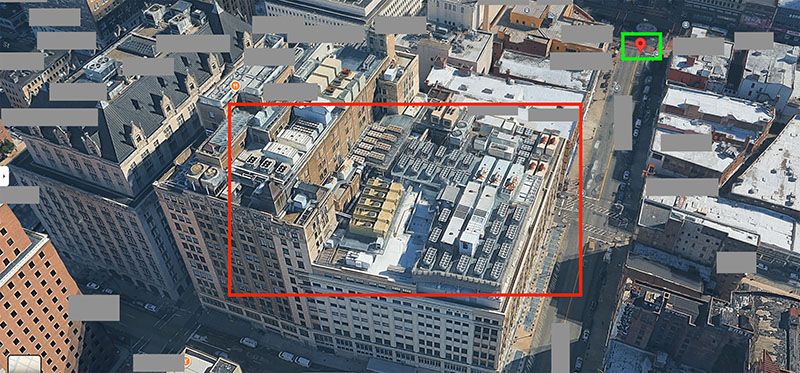
Understanding IP geolocation: Why 423 IP addresses share one coordinate
A natural question that arises when looking at our data: how can 423 distinct IP addresses all report the exact same GPS coordinates in New York City? The answer lies in how IP geolocation actually works. IP geolocation databases like MaxMind and IP2Location do not know where individual devices are physically located. Instead, they rely on ISP registration data. When an ISP like Verizon Business or Comcast acquires a block of IP addresses, they register that block to a geographic location—typically their regional office, network operations center, or a city center coordinate representing their service area.
The result: Every device using IP addresses from that block inherits the same registered coordinates, regardless of where the device physically sits. A BACnet controller in a Manhattan office building and a Niagara gateway in a Bronx warehouse might both resolve to the same coordinates at City Hall because they share the same Verizon Business IP address block.
Our analysis confirms this pattern: The top 15 coordinate clusters account for 5,788 devices (92% of our dataset), and all cluster at coordinates within 0.001 to 0.01 degrees of official city center locations. The ASN distribution at these clusters shows the major ISPs serving them:
- AT&T (AS7018): 1,129 devices at city-center coordinates
- Comcast (AS7922): 1,047 devices at city-center coordinates
- Verizon Business (AS6167, AS701): 1,669 devices at city-center coordinates
- Cox Communications (AS22773): 576 devices at city-center coordinates
What this means for our research: We cannot pinpoint devices to specific buildings or data centers based on IP geolocation alone. When we say “590 devices near San Jose data centers,” we mean 590 devices on ISP networks serving the San Jose metro area; they could be in the data center, in neighboring office buildings, or anywhere within that ISP's regional coverage. Our 1-kilometer (0.62-mile) proximity queries to known data-center coordinates caught devices whose ISP-registered locations fall within data-center clusters, not necessarily devices inside those facilities.
This limitation strengthens our core finding. The exposed ICS devices are real, verified through protocol-specific fingerprinting, and they exist in the same geographic markets where data centers operate. Whether they control the data center's cooling or the neighboring building's HVAC, these devices represent an attack surface. An adversary targeting data-center infrastructure would likely encounter them and could potentially exploit them for lateral movement or environmental disruption.
Deep connections: Patterns across the data
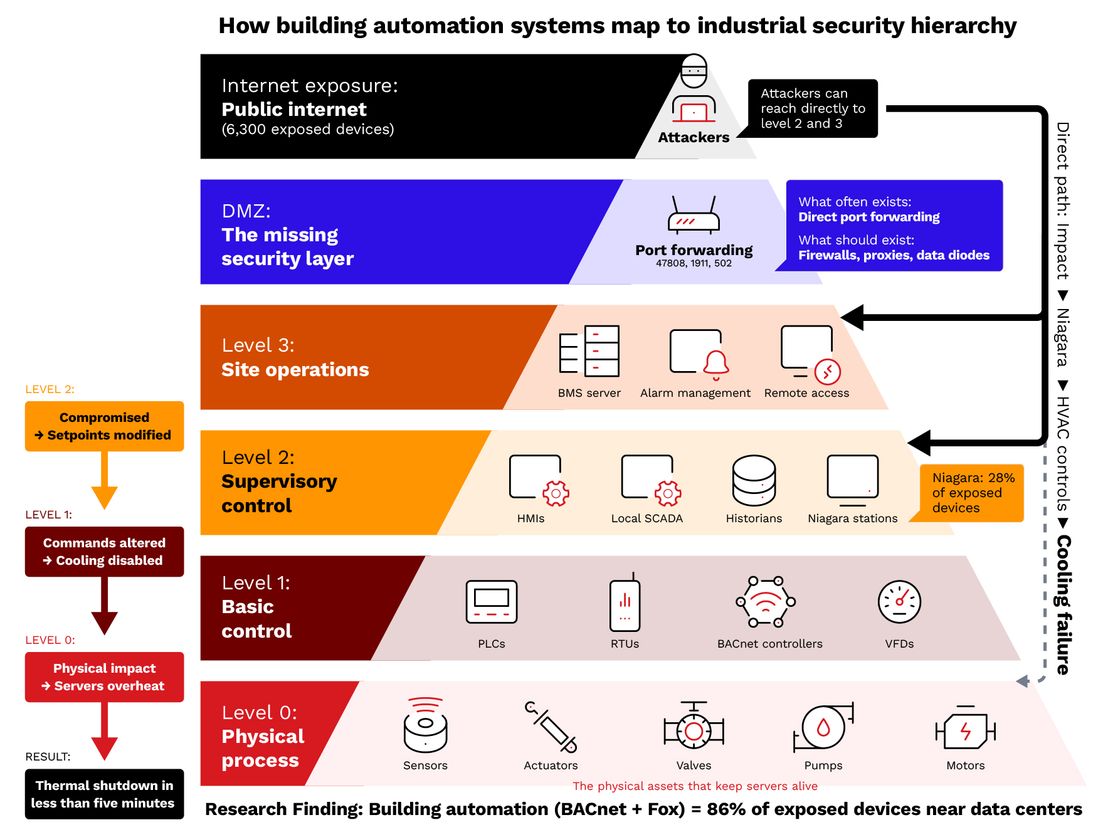
Beyond the aggregate statistics, the data reveals interesting patterns when we look at connections across locations, operators, and protocols. To understand the security implications of these exposed devices, we turn to the Purdue Model, the foundational framework for industrial control system security referenced by ISA/IEC 62443 and NIST 800-82. This hierarchical model defines security zones from Level 0 (physical processes like HVAC compressors and power distribution) through Level 3 (site operations including BAS controllers and HMIs), with a critical demilitarized zone (DMZ) separating operational technology from enterprise IT networks and the internet.
Our research findings show a departure from this security architecture. The 6,300 exposed devices we identified are essentially bypassing the DMZ layer entirely, creating direct pathways from the internet to systems from Level 1 through 3. When a BACnet controller managing cooling systems or a Niagara framework coordinating building automation is directly accessible via Shodan, the carefully designed security boundaries of the Purdue Model collapse, exposing critical data-center infrastructure to potential adversaries.
Figure 6 illustrates how building automation systems map to the Purdue Model for ICS security. While IT infrastructure benefits from layered security controls and dedicated monitoring, building automation often operates on a parallel network with minimal protection.
The same vendors everywhere
Niagara/Tridium devices appeared in every major metro area we analyzed. This suggests either widespread adoption of the platform or that a single system integrator or management company could be responsible for multiple exposed installations across the country. If one organization's Niagara deployment practices are insecure, the problem can potentially multiply across all their managed facilities.
ISP patterns reveal network architecture
The ISP distribution revealed that most legitimate ICS devices use business-class internet connections rather than the networks of enterprise data centers. Verizon Business, AT&T Business, and Cox Business were the most common carriers. This makes operational sense; building automation systems are often installed by facilities teams, not IT departments, and they connect through whatever business internet service is available at the loading dock or mechanical room.
This creates a security gap: The ICS devices may be in or near a data center, but they are not behind the data center's sophisticated network security. They are on a separate network, often with their own internet uplink, managed by a different team with different security priorities. The firewalls protecting the servers do not protect the chillers.
The multi-tenant problem
Colocation data centers present a unique challenge. When multiple tenants share a facility, who is responsible for the building automation security? The landlord typically operates the HVAC and power systems, while tenants manage their own racks. If the BAS is exposed to the internet, it is not the tenant's problem until it causes an environmental failure that takes down their equipment.
We observed high device counts near major colocation brands, though it is not always clear whether the exposed devices belong to the data center itself or to neighboring commercial buildings. IP geolocation does not distinguish between a BAS controller in the data center's mechanical room and one in the office building next door. Both show up at similar coordinates.
Multi-protocol gateways: The high-value targets
Among our 3,991 unique IP addresses, 143 devices (3.6%) respond on multiple ICS protocols. Of these, 125 run both Fox/Niagara and BACnet simultaneously. These are integration gateways, typically Niagara stations that aggregate multiple building automation protocols into a single management interface.
From an attacker's perspective, these multi-protocol devices are high-value targets. Compromising one gives access to multiple building systems. They are also more likely to be mission-critical, since they serve as the central nervous system connecting disparate building automation equipment.
Does age matter? Facility age and exposure correlation
The Business Insider dataset includes a "FIRST PERMIT ISSUE YEAR" field for each facility, derived from public utility filings and environmental permits. This allowed us to correlate a data center’s age with ICS exposure. The results were counterintuitive.
Conventional wisdom suggests that older data centers—built before cybersecurity was a priority—would have more exposed building automation. The data tells a different story.
| Era | Data centers | With exposure | Exposure rate | Average devices exposed |
|---|---|---|---|---|
| Pre-2010 (Legacy) | 266 | 13 | 4.9% | 85.7 |
| 2010 – 2015 (Matured) | 203 | 17 | 8.4% | 54.5 |
| 2016 – 2020 (Modern) | 267 | 27 | 10.1% | 32.9 |
| 2021 onwards (AI era) | 327 | 43 | 13.1% | 49.1 |
The exposure rate is higher for newer facilities, from 4.9% for pre-2010 facilities to 13.1% for those permitted since 2021. The Shodan data suggests that data centers built during the AI boom are more than twice as likely to have nearby ICS exposure as legacy facilities.
Why newer could mean more exposed
Several factors may explain this pattern:
- Speed over security: The AI infrastructure gold rush creates pressure to bring capacity online quickly. Building automation may be deployed with default configurations and remote access enabled for vendor convenience, with security hardening deferred or forgotten.
- Remote-first design: Modern building automation is designed for remote monitoring and management from day one. Older systems were often air-gapped by default and only connected to the internet as an afterthought. Newer systems come internet-connected out of the box.
- More complex automation: AI-era data centers require more sophisticated cooling and power management to handle high-density GPU racks. More automation means more attack surface.
- Greenfield development: Many new facilities are built in areas without established IT/OT security governance. The facilities team may not have inherited security policies from an existing organization.
However, the density of exposure tells a different story. When legacy data centers do have nearby exposure, they average 85.7 devices compared to 49.1 devices for AI-era facilities. This suggests that older facilities, when exposed, have accumulated more building automation over time or are in urban areas with higher density of neighboring commercial buildings.
Key insights: The obvious and not-obvious
Security research is most valuable when it unravels evidence not just for known problems, but also unexpected patterns that change how we think about risk. Here is what we found:
The obvious
- Building automation is the primary exposure vector. BACnet and Fox/Niagara account for 81% of high-confidence devices. This confirms what security researchers have long suspected: building automation systems are more commonly internet-exposed than heavy industrial SCADA. The protocols controlling HVAC and lighting are more accessible than those controlling power grids.
- Geography tracks infrastructure investment. Silicon Valley, New York, and Phoenix—the major data-center markets—show the highest exposure counts. Where data centers cluster, so do exposed ICS devices. Investment in compute infrastructure correlates with exposure of physical infrastructure.
- Legacy vendors dominate. Niagara/Tridium alone represents 28% of identified devices. These platforms were designed for interoperability and remote access in an era before security-by-design. The technical debt of a decade of "connect first, secure later" is visible in the data.
- Most exposed devices are on business-class ISPs, not enterprise networks. Building automation lives on a parallel network infrastructure from the data center's IT systems. The sophisticated firewalls and IDS protecting servers typically have no visibility into BAS traffic.
The not-obvious
- Newer data centers are more likely to have exposed ICS, not less. Facilities permitted since 2021 have a 13.1% exposure rate, compared to just 4.9% for pre-2010 facilities. The AI infrastructure boom's emphasis on speed, combined with remote-first building automation design, appears to create more exposure, not less. This questions the assumption that modern facilities are more secure.
- Multi-protocol gateways are high-value, concentrated targets. 143 IP addresses (3.6%) respond on multiple ICS protocols; 125 of these run Fox/Niagara and BACnet together. These integration gateways connect multiple building systems through a single device. Compromising one gives access to the entire building automation ecosystem.
- SCADA exposure is surprisingly low, but that's not necessarily good news. Only four high-confidence DNP3 devices passed our filters. This could mean data centers are not using internet-exposed SCADA, or it could mean their SCADA systems are on private networks we can't see. The absence of evidence is not evidence of absence, and the low count also reflects DNP3's 90% false-positive rate on port 20000, which may have masked real devices that did not emit enough protocol-specific signatures.
- IP geolocation clusters reveal shared infrastructure risks. When more than 300 ICS devices map to identical GPS coordinates, they are sharing the same ISP-registered IP address block. This means multiple organizations' building automation may route through the same network infrastructure. A compromise at the ISP or managed services level could affect dozens of facilities simultaneously.
- Vertiv/Liebert presence indicates direct exposure of a data center’s infrastructure. Unlike generic BACnet HVAC controllers that could belong to any commercial building, Vertiv and Liebert specialize in equipment designed specifically for data centers: precision cooling (CRAC/CRAH units), UPS systems, and power distribution. These 16 internet-accessible devices strongly suggest the data center’s own infrastructure, not just neighboring buildings, is exposed.
- The honeypot ratio implies active adversary interest. We identified 17 likely honeypots among our results—IP addresses running over five ICS protocols simultaneously. Honeypots can also be running in data centers, so it’s not uncommon to see these overlap. No ICS/SCADA/PLC will have more than a handful of ports open, so a server with hundreds of ports open close to the data center is a strong indication of a honeypot. Security researchers and threat intelligence teams deploy these to study attacker behavior. Their presence in data-center proximity searches suggests adversaries are actively scanning for ICS devices near critical infrastructure.
- Banner information reveals operational details that aid targeting. Beyond just "this device exists," banners disclosed zone names ("Server Room 3-East"), equipment counts, firmware versions with known vulnerabilities, and in some cases maintenance contact information. An attacker doesn't just know a BAS exists; they know its make, model, patch level, and sometimes which staff to target for social engineering.
- The security gap is architectural, not just operational. The IT/OT divide is not just about different teams—it is physically separate networks with separate internet uplinks, separate monitoring, and often separate security policies (or lack of policies). Fixing this requires organizational change, not just technical controls. We cannot firewall our way out of a governance problem.
The physical blind spot
The not-obvious insights point to a systemic issue: security models for data centers assume the perimeter ends at the server rack. Physical infrastructure (such as cooling, power, and environmental controls) is treated as a separate domain, managed by separate teams, connected to separate networks. But from an attacker's perspective, these components are all part of the same target. Disabling cooling has the same effect as a DDoS attack—the services go offline.
The presence of vendors whose products are designed specifically for data centers (Vertiv, Liebert, Schneider Electric) in our high-confidence results suggests this is not just about neighboring office buildings with poorly configured BAS installations. Some of these devices likely control the data center's own infrastructure. The attack surface extends beyond the logical network into the physical plant.
Security implications: What's actually at risk?
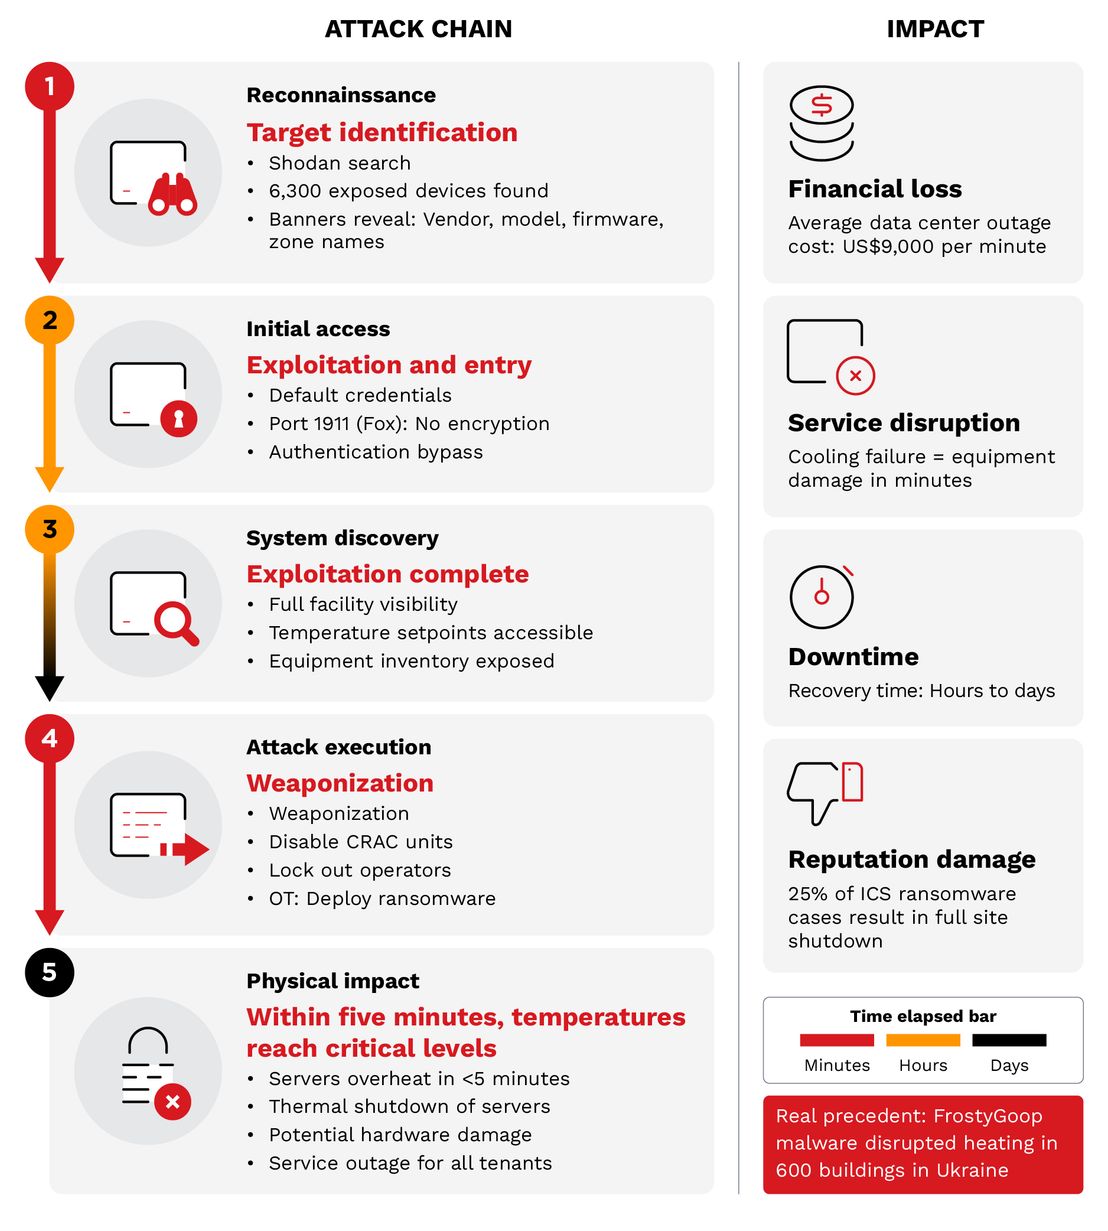
Building automation systems control physical processes. An attacker with access to these systems can cause real-world impact. Figure 7 depicts a realistic attack scenario showing how an attacker could exploit an exposed BACnet controller to compromise a data center’s operations.
Operational disruption
An attacker who successfully compromises a BACnet controller can execute several malicious actions that can disrupt operations:
- CRAC/CRAH units can be disabled, causing servers to overheat within minutes, leading to thermal shutdowns or permanent hardware damage.
- Temperature or humidity setpoints can be manipulated to push equipment outside operating specifications, reducing lifespan.
- False fire alarms can be triggered, or environmental monitoring can be disrupted, halting operations while staff investigates phantom incidents.
- Credentials on the BAS can be changed to lock out facilities staff, preventing any response to the incident.
Reconnaissance and physical security
Exposed BAS devices often reveal detailed facility information in their banners. Zone configurations can imply floor plans, and equipment inventories can reveal security posture. Maintenance schedules show staffing patterns, and configuration data sometimes includes personnel names. This intelligence could inform physical intrusion or social engineering attacks.
ICS ransomware: An emerging threat
Ransomware for ICS/OT asset owners has evolved from an emerging threat to a documented crisis. According to Dragos, ransomware attacks targeting industrial organizations increased 87% in 2024, with 1,693 documented incidents. The number of ransomware groups targeting industrial systems jumped to 80, a 60% increase from 2023. Manufacturing remains the most affected sector (over 50% of victims), and 25% of cases resulted in full OT site shutdowns.
Recent high-profile examples demonstrate the real-world impact: In February 2024, the Change Healthcare ransomware attack (BlackCat) caused US$2.9 billion in losses and compromised 100 million patient records. Three months later, Ascension Health's 142 hospitals were locked out of critical care coordination systems. Johnson Controls, which makes building automation for federal facilities, suffered a ransomware attack that disrupted operations across its York and Tyco subsidiaries. In the water sector, Arkansas City, Kansas, switched to manual operations after a September 2024 attack on its treatment facility prompted an FBI investigation.
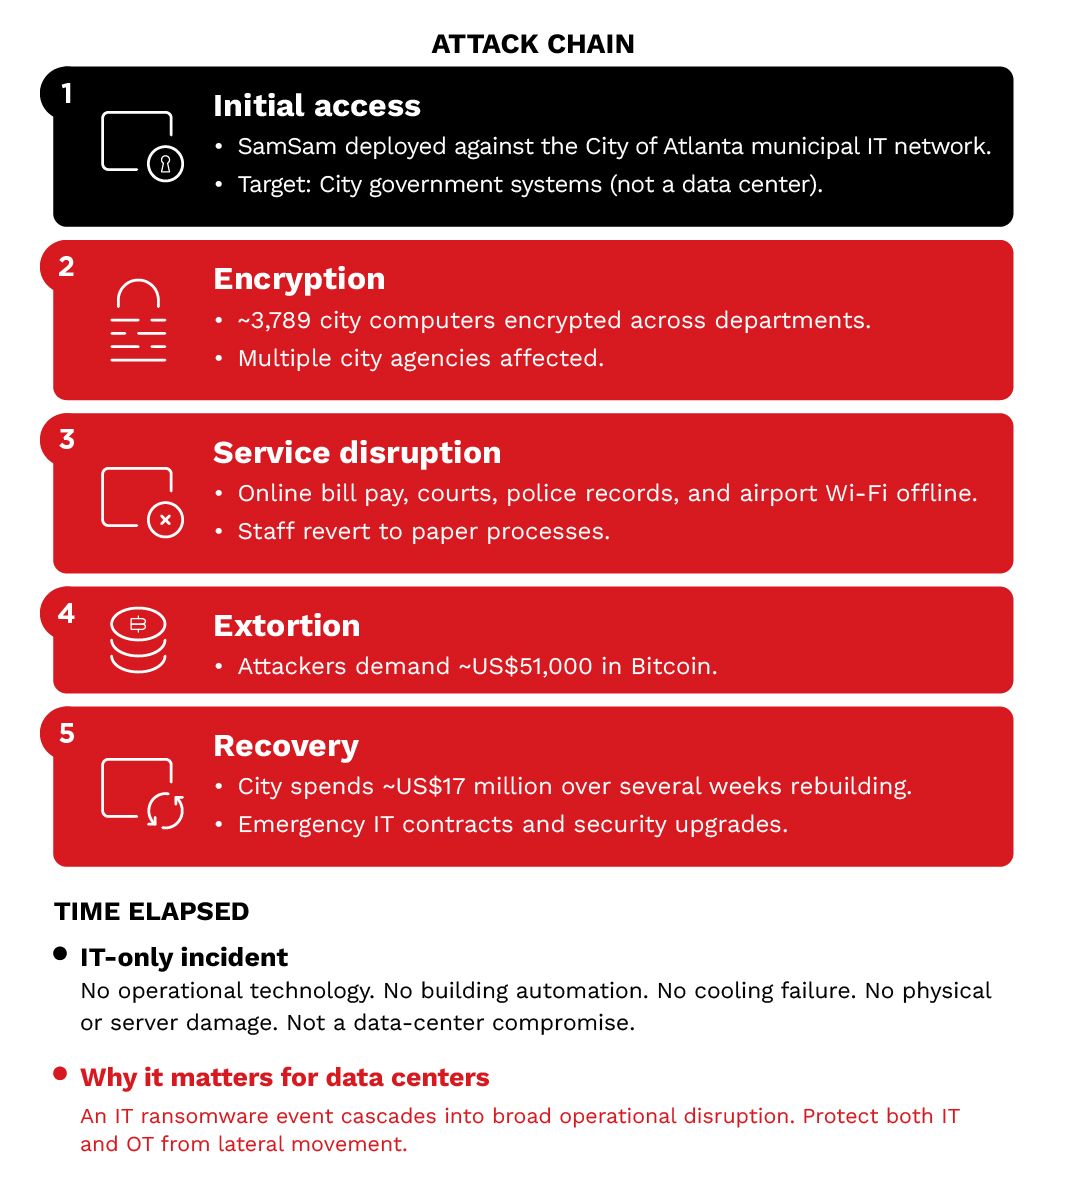
The 2018 SamSam ransomware attack on Atlanta's municipal infrastructure illustrates how ransomware can devastate city services. The attack encrypted servers across multiple city departments, forcing Atlanta to take down many systems and revert to paper-based processes. The attackers demanded approximately US$51,000 in Bitcoin. The city ultimately spent over US$17 million on recovery, including emergency IT contracts and security improvements. For those who manage data centers, this case demonstrates how ransomware targeting IT systems can cascade into widespread operational disruption and underscores the importance of protecting both IT and OT systems from lateral movement.
Two new ICS-specific malware strains (FrostyGoop and Fuxnet) were discovered in 2024, bringing the all-time total to nine. FrostyGoop, in particular, directly targeted OT environments and was used to disrupt district heating in Ukraine during sub-zero temperatures, affecting 600 apartment buildings. For data centers, the threat is immediate: their absolute dependency on continuous cooling and power makes them attractive extortion targets. Ransomware threatening to disable cooling during a summer heat wave creates enormous pressure to comply; the alternative is thermal damage to millions of dollars in equipment.
Our research identified 159 high-confidence Modbus devices (port 502) near data centers. FrostyGoop specifically targets Modbus TCP, the same protocol these devices use. While we cannot confirm whether any of these devices are directly connected to any data center’s cooling infrastructure, their presence in places where data centers operate represents a potential attack surface for FrostyGoop-style manipulation. Dragos researchers note that over 46,000 internet-exposed ICS devices communicate via Modbus globally, making protocol-specific attacks like FrostyGoop a systemic threat rather than an isolated incident.
Vulnerability assessment of exposed devices
To quantify the risk posed by these exposed devices, we mapped known Common Vulnerabilities and Exposures (CVEs) to the specific software versions identified through banner analysis. The results reveal 53 unique CVEs across 10 vendor platforms, with Common Vulnerability Scoring System (CVSS) scores reaching 10.0. Seven CVEs scored 9.8 or higher, two entries appear in the Cybersecurity and Infrastructure Security Agency (CISA) Known Exploited Vulnerabilities (KEV) catalog, and three product lines are end-of-life with no future patches available.
| CVE | CVSS | Vendor | Impact | Devices affected |
|---|---|---|---|---|
| CVE-2022-1161 | 10.0 | Rockwell Automation | Stuxnet-like stealth code modification | 87 CompactLogix |
| CVE-2024-8525 | 10.0 | Carrier/Automated Logic | Unauthenticated RCE via file upload | 64 i-Vu/WebCTRL v7.0 |
| CVE-2021-38450 | 9.9 | Trane | Authenticated RCE (code injection) | 50 Tracer SC (EOL) |
| CVE-2019-9569 | 9.8 | Delta Controls | Unauthenticated RCE via BACnet overflow | 237 enteliBUS |
| CVE-2017-7898 | 9.8 | Rockwell Automation | No login lockout (brute force) | 144 MicroLogix 1400 |
| CVE-2016-0868 | 9.8 | Rockwell Automation | RCE via stack-based buffer overflow | 22 MicroLogix 1100 |
| CVE-2015-6490 | 9.8 | Rockwell Automation | RCE via buffer overflow | 22 MicroLogix 1100 |
| CVE-2025-6185 | 9.3 | Obvius/Leviton | XSS/session hijack — NO PATCH | 70 AcquiSuite |
| CVE-2012-4701 | 9.3 (v2) | Tridium | Directory traversal + RCE | 434 NiagaraAX (EOL) |
The most dangerous finding is CVE-2022-1161 (CVSS 10.0), affecting 87 Rockwell Automation CompactLogix PLCs in our dataset. This vulnerability allows an attacker to modify running PLC code while the engineering workstation displays the original, unmodified program—the same class of stealth attack employed by Stuxnet. The related prerequisite CVE-2021-22681 (authentication bypass) was added to CISA’s KEV catalog with evidence of active exploitation. A second CVSS 10.0 vulnerability, CVE-2024-8525, enables completely unauthenticated remote code execution via file upload on 64 Carrier/Automated Logic WebCTRL devices running end-of-support version 7.0.
All 237 Delta Controls enteliBUS controllers in our dataset appear to be running firmware vulnerable to CVE-2019-9569 (CVSS 9.8), an unauthenticated remote code execution flaw via crafted BACnet packets—despite the patch being available for over six years. The Tridium Niagara Framework is the single largest platform in our dataset, with 1,812 devices across both detection methods: 1,453 identified via the Fox protocol (port 1911) and approximately 359 through banner analysis on the BACnet port (47808). It carries 17 CVEs. Of these, 434 devices run end-of-life NiagaraAX 3.x, and approximately 1,370 Niagara4 devices are vulnerable to a recently disclosed exploit chain (CVE-2025-3943 and CVE-2025-3944) enabling root-level remote code execution on QNX-based JACE controllers.
Perhaps the most troubling remediation scenario involves the 70 Obvius/Leviton energy monitoring devices affected by CVE-2025-6185 (CVSS 9.3). Leviton has not responded to CISA, leaving device owners with no patch, no vendor mitigation guidance, and no timeline for a fix. An additional 548 devices across three product lines—Tridium NiagaraAX 3.x, Trane Tracer SC, and Carrier WebCTRL v7.0—have reached end-of-life status with no future security patches available.
Beyond individual CVEs, the protocols themselves represent a fundamental vulnerability. BACnet (3,664 devices), Modbus (159 devices), and Fox (1,453 devices) all lack authentication and encryption by design. The FrostyGoop malware, discovered in 2024, directly exploits Modbus TCP and was used to disrupt district heating for more than 600 apartment buildings in Lviv, Ukraine during sub-zero temperatures. All 159 Modbus devices in our dataset speak the same protocol FrostyGoop targets. In aggregate, 964 of the 6,300 high-confidence findings (15.3%) have a CVSS score of 9.0 or above, and 83.7% of the 6,300 high-confidence findings are inherently vulnerable due to the use of protocols that were never designed for internet exposure.
Why are these systems exposed?
- Legacy installations: Many BAS systems were deployed 10 to 20 years ago, before cybersecurity was a priority. The Niagara 4.x installations we are seeing today evolved from designs created when “security” meant a password on the login screen.
- Organizational silos: Building systems are managed by facilities teams who report to operations, not IT or IT security. These teams operate under different policies, maintain separate networks, and apply different vulnerability management practices, if any.
- Vendor remote access: Equipment vendors often require remote access for maintenance, troubleshooting, and software updates. The easiest solution is to use static IP addresses and port forwarding, not VPN.
- Shadow OT: Facilities teams sometimes connect controllers to business internet without IT involvement. These devices become invisible to IT security teams until something goes wrong. In leased spaces, tenants may have no control over the building’s BAS. The building owner manages HVAC and power systems, meaning tenants inherit whatever security posture (or lack thereof) the owner maintains. Organizations should evaluate BAS security as part of their lease agreements and ensure building owners meet minimum security standards.
Recommendations: A practical action plan
Most of these exposures are fixable with straightforward network changes. The challenge is organizational: getting the right teams talking and taking ownership. The TrendAI Vision One™ platform can accelerate this process by providing unified visibility across both IT and OT environments, bridging the gap between security teams and facilities operations. Here’s a practical roadmap.
Immediate actions
- Search Shodan for your own exposure by querying "geo:[your-lat],[your-lon],1" and your organization’s IP address ranges. You can also use "org:[your ISP name]" to find devices registered to your network (note that some Shodan filters require a paid subscription). As a free alternative, scan your IP address space with ICS-specific Nmap scripts such as bacnet-info, modbus-discover, enip-info, s7-info, and fox-info. Establishing this visibility before an attacker does is the first step in reducing exposure. Complement this with the TrendAI Vision One™ Cyber Risk Exposure Management (CREM) capability to continuously discover internet-facing ICS and BAS devices across your environment, including exposed BACnet controllers, Niagara platforms, and Vertiv/Liebert equipment that may not appear in traditional asset inventories.
- Check for port forwarding rules by reviewing your edge routers and firewalls for any network address translation (NAT) rules forwarding ports 47808 (BACnet), 1911 (Fox), 502 (Modbus), or 44818 (EtherNet/IP) to internal systems. These were often set up years ago and forgotten.
- Identify your BAS network architecture by finding out if building automation has its own internet uplink separate from the data center’s network. If it does, that's your blind spot.
Short-term fixes
- Remove direct internet exposure by taking BAS devices off the public internet. If remote access is needed, implement VPN, Secure Shell (SSH) tunneling, or zero-trust network access (ZTNA). While remediation is underway, enable virtual patching through the intrusion prevention system (IPS) rules in TrendAI Vision One™ to protect in real time against known CVEs (CVSS 7.5 to 10.0) affecting Tridium Niagara, Schneider Electric, and BACnet implementations on unpatched systems.
- Change default credentials on all exposed devices, as Niagara stations and many BACnet controllers often ship with known default usernames and passwords. An exposed device with default credentials requires no exploitation—it is already accessible to anyone who knows the defaults. Enforce strong authentication on all exposed devices and use the TrendAI Vision One™ Vulnerability Management capability to identify systems still running default or weak credentials alongside unpatched CVEs.
- Notify your landlord or colocation provider if you are a tenant—the building automation may not be your system, but it becomes your problem if it fails. Ask your provider about their BAS security posture.
Strategic changes
- Bridge IT and OT governance by bringing facilities teams under the security umbrella. Add BAS systems to your asset inventory, vulnerability management, and security monitoring programs. Include HVAC and power systems in your risk assessments. Remember that third-party HVAC contractors can also be an attack vector—the 2013 Target data breach, which compromised 40 million payment cards, originated through a stolen HVAC vendor credential. Ensure that your HVAC and BAS contractors meet your organization’s security standards.
- Mandate security in vendor contracts by requiring VPN connections for any remote access. Eliminate "static IP address and port forwarding" as an acceptable configuration. Include BAS security requirements in requests for proposals (RFPs) for new equipment.
- Implement network segmentation by isolating OT networks from IT networks and from the internet. Use firewalls or DMZ architectures to control traffic between zones to restore Purdue Model compliance and eliminate direct internet-to-OT pathways. Monitor east-west traffic within the OT network using TrendAI Vision One™ Network Security and TrendAI Vision One™ XDR for Networks.
- Deploy OT-specific monitoring using OT-aware security platforms that can detect anomalous BACnet and Modbus traffic, including FrostyGoop-style manipulation targeting the 159 Modbus devices identified in this research. Use the TrendAI Vision One™ Vulnerability Management capability to prioritize patching by risk score; the TrendAI Vision One™ Threat Intelligence Hub provides ICS-specific malware signatures, known CVE exploitation patterns, and hunting queries to sweep your environment for indicators of compromise. The TrendAI Vision One™ Workbench can then correlate alerts across IT/OT boundaries to investigate lateral movement from exposed BAS devices into systems from Level 1 through 3.
For security teams
- Add OT to your scope by proactively engaging with facilities teams to understand the OT landscape. Your attack surface is bigger than what your asset inventory shows. Use TrendAI Vision One™ CREM to maintain a continuous, unified view of both IT and OT assets, ensuring exposed devices don’t fall through the gap between teams.
- Include OT in incident response plans. What happens if someone compromises the BAS? Who do you call? Can facilities staff isolate systems? Practice this scenario before you need it. The TrendAI Vision One™ Workbench provides a unified investigation console that correlates alerts across IT/OT boundaries, enabling security teams to detect exploitation attempts against known ICS CVEs and trace lateral movement paths from compromised BAS devices.
- Monitor for ICS-specific threats using threat intelligence and honeypot data for early warning. Our research found 17 honeypots near data centers; someone is already watching this attack surface. Use the TrendAI Vision One™ Threat Intelligence Hub to track ICS-specific malware strains like FrostyGoop, monitor CVE exploitation patterns targeting building automation platforms, and configure Workbench alerts for unexpected internet-to-OT connections and Modbus protocol anomalies.
Conclusion
The thousands of exposed ICS devices identified in this research represent an invisible attack surface that exists alongside the sophisticated cyber defenses data centers deploy for their IT infrastructure. These aren't theoretical vulnerabilities. They're real devices, discoverable right now, running protocols designed for operational convenience rather than security.
- BACnet and Fox/Niagara account for 81% of exposed devices, confirming building automation as the primary exposure vector near data centers.
- Newer data centers (2021 onwards) have a 13.1% exposure rate versus 4.9% for pre-2010 facilities—the AI infrastructure boom correlates with increased OT exposure.
- 143 multi-protocol gateway devices (3.6%) bridge multiple building systems through a single internet-accessible endpoint.
- Building automation systems operate on parallel networks with separate internet uplinks, outside the scope of the data center's IT security controls.
- Known vulnerabilities (CVSS 7.5 to 10.0) affect major platforms found in the dataset, including Tridium Niagara, Schneider Electric, and BACnet implementations.
BACnet and Niagara devices, protocols, and platforms control HVAC, power distribution, and environmental monitoring. Their concentration in this research means the physical infrastructure supporting the data center’s operations is more exposed than most operators realize. The firewalls protecting the servers don't necessarily protect the chillers cooling the building.
Awareness is the first step toward remediation. By understanding what is exposed and why, organizations can take targeted actions to reduce risk and protect the physical infrastructure that keeps their data centers running. Identifying and communicating these vulnerabilities was the primary goal of this research.
Ultimately, no defense is impregnable against determined adversaries. The key principle of defense is to assume compromise and take countermeasures. The question is not whether ICS exposure is a problem—the data makes that abundantly clear. The question is what we are going to do about it.
More information on this research is available in the appendix.