
Key Takeaways
- TrendAI™ Research observed large-scale use of advertising infrastructure for geolocation tracking, advertising technology surveillance, and intelligence gathering. Data from these activities is valuable for precise targeting of key individuals in sensitive locations, including active conflict zones.
- The group tracked by TrendAI™ Research as SHADOW-EARTH-79 was found to be the single largest bidder for ad impressions in 49 countries. Many of those countries are present in travel advisory or dangerous country lists from several governments. Others had critical events such as elections close to the time of the activities observed. The group is also among the top bidders for ad impressions in sanctioned and active-conflict states where there is no legitimate commercial advertising demand.
- SHADOW-EARTH-79 is also the number one bidder in 105 individual countries in Starlink traffic that we observed. It accounts for approximately 13% of all winning bid events in Starlink traffic, five times higher than average (approximately 3%) bids for other bidders, and the highest of any high-volume buyer. Starlink is widely used in conflict zones where terrestrial networks are degraded.
- Back-end systems operated by SHADOW-EARTH-79 were identified and reconstructed from JavaScript bundles with AI-assisted analysis. This allowed us to understand and derive insights from the workings of a targeted advertisement intelligence operation. The combination of anomalous targeting and observed features of the “client”-facing interface suggests a tracking and targeting surveillance platform.
The real-time bidding (RTB) process auctions a device’s advertisement impressions by the millisecond. This well-defined process determines the advertisements you see every day on your computer and mobile device.
To run the auction, additional information from devices is provided to every bidder competing for the slot, and bidders the device owner never interacts with directly. The information provided can include the device’s geolocation, IP address, autonomous system number (ASN), and device identifiers such as type, model, and screen size. When combined with advertising ID, click tracking, and location history, the collective information can be used to build an extensive behavioral profile of users. These users can later be the recipient of targeted ads.
After the RTB process is completed and a winning party is selected, the winning bidder delivers creative materials. These are normally image files but can also be manipulations of them that can permit the delivery of JavaScript that could perform other actions such as data collection for extensive profiling and user surveillance. This can include the following:
- User movement profiling using location information
- User profiling using user agent, language, carrier, and device vendor details
- User profiling using interests gathered on the site or app serving the ad
The malicious use of digital advertisement is not new; malvertising has been a threat for at least two decades. Over that time, the advertisement ecosystem evolved to combat a variety of fraud activities related to online advertisement, such as the enforcement of transparency where the supply side of advertising technology is documented.
However, there remains space for abuse on the demand side. This research shows how bidders can use advertisement information to collect intelligence or optimize early stages of the attack kill chain. This includes collecting information about targets, profiling potential targets, and possibly attempting to further deliver specific content to a narrow selection of devices that are potentially valuable to surveil.
This research documents the clusters of activities related to this potentially malicious surveillance. It analyzes the activity and supporting infrastructure of an ad-tech entity tracked by TrendAI™ Research as SHADOW-EARTH-79. It is a group observed to exploit the rich set of information that becomes available during the RTB process when advertisements are placed on digital platforms in their cyber operations.
Data and methodology
Findings in the following sections are derived from advertising network telemetry data logs captured in TrendAI™ telemetry. The analysis was done on a dataset that covers a single demand-side platform (DSP) due to technical limitations faced while analyzing other DSP data. Nevertheless, we believe that our findings are notable.
To derive information related to advertisement “bidstreams,” we analyzed the information that passed through a bid request during a real-time bidding auction. Each bid request URL was parsed to extract the bidder identifier, destination IP address, geolocated country, and the originating network (ASN), among other information analyzed.
Events were then aggregated per country, and per ASN. We also analyzed a subset of traffic originating from SpaceX Starlink address space (AS14593, “SPACEX-STARLINK”).
In this research, “lift” denotes a buyer’s share of a given traffic slice divided by its share of overall traffic. A lift above 1.0 means the buyer bids on that slice more often than its overall footprint would predict.
It is important to note that the analysis and observations in this research are solely based on and limited by our own telemetry data and visibility. This means that the actual size and scope of the campaign is likely to be significantly larger. Table 1 illustrates the volume of the data we have analyzed:
| Metric | Value |
|---|---|
| Collection window (aggregate series) | Dec. 31, 2025, to Aug. 15, 2026 |
| Collection window length | 228 days |
| Collection window (row-level detail) | Jul. 29, 2026, to Aug. 15, 2026 (for detailed breakdown) |
| Total captured requests | 84,710,348 |
| Total captured requests per day | 371,537 |
| Total buyer-attributed events | 8,442,507 |
| Buyer-attributed events per day | 37,029 |
| Total ads (impressions served) | 6,368,517 |
| Ads per day | 27,932 |
| Total conversions | 1,518,112 |
| Total other events (clicks, wins, renders, Video Ad Serving Template errors) | 555,878 |
| Impression share of buyer-attributed events | 75.4% |
| Conversion share of buyer-attributed events | 18.0% |
| Other-event share of buyer-attributed events | 6.6% |
| Distinct buyer seats observed | 154 |
| Distinct countries observed | 232 |
| Distinct buyer seats per day (mean) | 92.5 |
| Distinct advertisement customers per day (mean) | 186,541 |
| Distinct advertisement customers per day (median) | 183,298 |
| Advertisement customers seen on exactly one day | 463,511 (44.3%) |
| Advertisement customers seen on 14 or more of 18 days | 20,133 (1.9%) |
| New advertisement customer arrival rate, day 18 | 16.1% of that day's population |
| Total number of IP addresses that got ads served | 1,045,818 |
Targeted countries (all traffic)
TrendAI™ analysis showed that SHADOW-EARTH-79 is the number one winning bidder in 49 countries where advertisement data is auctioned. In several cases, it captures an implausibly dominant share of all bidding activity, which is inconsistent with normal competitive ad buying.
Table 2 lists the countries where SHADOW-EARTH-79 is the top buyer, ranked by its share of all bid events in that country.
Note the near-monopoly shares in Hungary, Israel, Egypt, Azerbaijan, and Venezuela where SHADOW-EARTH-79’s share of bids is between 72% and 91%. It also has a high share of bids in Thailand, Malaysia, Saudi Arabia, and the United Arab Emirates.
| Country | Total bid events | SHADOW-EARTH-79 events | SHADOW-EARTH-79 share | Unique IP addresses |
|---|---|---|---|---|
| Tuvalu | 22 | 21 | 95.5% | 16 |
| Hungary | 70,500 | 64,218 | 91.1% | 8,920 |
| Israel | 136,917 | 123,396 | 90.1% | 13,828 |
| Central African Republic | 6 | 5 | 83.3% | 3 |
| Falkland Islands | 17 | 14 | 82.4% | 7 |
| Niger | 136 | 111 | 81.6% | 82 |
| Cameroon | 352 | 287 | 81.5% | 158 |
| Svalbard and Jan Mayen | 5 | 4 | 80.0% | 5 |
| Egypt | 21,511 | 16,605 | 77.2% | 7,092 |
| Armenia | 931 | 717 | 77.0% | 297 |
| Northern Mariana Islands | 58 | 44 | 75.9% | 37 |
| Azerbaijan | 10,346 | 7,776 | 75.2% | 1,119 |
| Venezuela | 24,517 | 17,696 | 72.2% | 3,317 |
| Micronesia (Federated States of) | 14 | 10 | 71.4% | 13 |
| Chad | 24 | 17 | 70.8% | 20 |
| Eswatini | 423 | 290 | 68.6% | 79 |
| Nauru | 3 | 2 | 66.7% | 3 |
| Marshall Islands | 46 | 30 | 65.2% | 25 |
| Burundi | 156 | 99 | 63.5% | 61 |
| Qatar | 36,022 | 22,059 | 61.2% | 4,788 |
| Saint Barthélemy | 85 | 52 | 61.2% | 35 |
| Mayotte | 103 | 63 | 61.2% | 53 |
| South Sudan | 123 | 71 | 57.7% | 59 |
| Syria | 47 | 27 | 57.4% | 25 |
| Benin | 119 | 68 | 57.1% | 55 |
Starlink (satellite-internet) targeting
Over-representation across all Starlink traffic
In Starlink IP space traffic that we observed, SHADOW-EARTH-79 is the second-largest winning bidder by raw volume. However, examining the statistics and saturation of the group’s ad impression buying strategy reveals an obvious skew towards buying ad impressions on Starlink addresses, compared with its overall footprint.
Table 3 ranks buyers with 500 or more Starlink events by lift. To better understand the numbers, we computed the following:
- The total number of specific ads served
- The total number of ads served versus the number of ads for Starlink IP ranges (share of overall Starlink ads)
- The baseline share (the buyer's share of all ads served)
| Buyer | Starlink ads served | Share of overall Starlink ads served | Baseline share | Lift |
|---|---|---|---|---|
| inmobi | 2,542 | 0.5% | 0.1% | 5.0× |
| SHADOW-EARTH-79 | 66,208 | 12.9% | 2.6% | 4.9× |
| tu | 17,993 | 3.5% | 1.2% | 3.0× |
| iqvia | 773 | 0.2% | 0.1% | 2.5× |
| BUYER2 | 516 | 0.1% | 0.04% | 2.5× |
| adswizz | 5,089 | 0.9% | 0.4% | 2.3× |
| steelhouse | 196,791 | 38.4% | 17.9% | 2.2× |
| tatari | 9,235 | 1.80% | 0.9% | 2.1× |
| match2one | 7,962 | 1.6% | 0.8% | 1.9× |
| azira | 4,025 | 0.8% | 0.4% | 1.9× |
| deseret | 3,342 | 0.7% | 0.4% | 1.6× |
| miqnam | 964 | 0.2% | 0.1% | 1.4× |
| seesource | 1,583 | 0.3% | 0.2% | 1.3× |
| chicory | 1,959 | 0.4% | 0.3% | 1.2× |
| brstmedia | 877 | 0.2% | 0.2% | 1.1× |
Note: The buyers listed are identifier names used in the research, except for SHADOW-EARTH-79 and BUYER2, which have been renamed.
Countries where SHADOW-EARTH-79 is the number one Starlink winning bidder
SHADOW-EARTH-79 is the winning bidder in 105 countries on Starlink traffic. Some of these countries (Cameroon, Syria, Sudan, Myanmar, Libya) are countries where Starlink is officially banned or restricted by regulation. We geolocated IP addresses from those countries using a number of techniques (including cross-referencing with the Starlink official geo-feed databases). However, as with all IP geolocation there will be some margin for error.
In comparing our own geolocation data with Starlink’s geo-feed database, we found only two conflicting elements. First, the IP range that we geolocate to Myanmar is shown as “Canada” in Starlink’s geo-feed. Second, the IP range that we geolocate to Sudan is shown as belonging to Niger in Starlink’s geo-feed. All other geolocations appear to be accurate.
In another notable observation, if we look at the ASNs where the advertisements were served, we can clearly see a skew toward ASNs belonging to government networks in some countries.
Table 4 shows the analyzed telemetry from June 2024 through June 2026.
| Rank | Code | Country | SHADOW-EARTH-79 Starlink bids | All buyers Starlink bids | SHADOW-EARTH-79 share | Buyers present |
|---|---|---|---|---|---|---|
| 1 | AU | Australia | 21,551 | 38,066 | 56.6% | 33 |
| 1 | AR | Argentina | 4,244 | 4,650 | 91.3% | 15 |
| 1 | NZ | New Zealand | 4,138 | 8,602 | 48.1% | 25 |
| 1 | PH | Philippines | 3,983 | 4,470 | 89.1% | 17 |
| 1 | JP | Japan | 2,290 | 2,771 | 82.6% | 14 |
| 1 | BR | Brazil | 2,111 | 4,237 | 49.8% | 25 |
| 1 | MY | Malaysia | 1,392 | 1,579 | 88.2% | 9 |
| 1 | ES | Spain | 1,352 | 1,542 | 87.7% | 20 |
| 2 | CL | Chile | 1,273 | 4,405 | 28.9% | 10 |
| 1 | FR | France | 1,133 | 1,753 | 64.6% | 29 |
| 1 | IT | Italy | 1,092 | 1,691 | 64.6% | 18 |
| 1 | CO | Colombia | 1,035 | 1,343 | 77.1% | 19 |
| 1 | SG | Singapore | 958 | 989 | 96.9% | 6 |
| 1 | NG | Nigeria | 663 | 706 | 93.9% | 7 |
| 1 | MX | Mexico | 557 | 833 | 66.9% | 24 |
| 1 | MG | Madagascar | 417 | 457 | 91.2% | 2 |
| 2 | PE | Peru | 394 | 1,183 | 33.3% | 7 |
| 1 | DE | Germany | 377 | 1,153 | 32.7% | 24 |
| 1 | FJ | Fiji | 369 | 461 | 80.0% | 4 |
| 1 | DO | Dominican Republic | 344 | 349 | 98.6% | 4 |
| 4 | GB | United Kingdom | 314 | 3,338 | 9.4% | 25 |
| 1 | WS | Samoa | 303 | 349 | 86.8% | 3 |
| 1 | GR | Greece | 278 | 341 | 81.5% | 9 |
| 1 | GH | Ghana | 276 | 277 | 99.6% | 2 |
| 1 | BG | Bulgaria | 263 | 365 | 72.1% | 8 |
| 1 | QA | Qatar | 240 | 276 | 87.0% | 8 |
| 1 | SZ | Eswatini | 230 | 230 | 100.0% | 1 |
| 1 | CM | Cameroon | 222 | 222 | 100.0% | 1 |
| 1 | ZM | Zambia | 219 | 302 | 72.5% | 5 |
| 1 | VU | Vanuatu | 216 | 322 | 67.1% | 4 |
| 1 | ZW | Zimbabwe | 216 | 234 | 92.3% | 4 |
| 1 | KE | Kenya | 165 | 271 | 60.9% | 6 |
| 1 | UY | Uruguay | 152 | 153 | 99.3% | 2 |
| 1 | MW | Malawi | 148 | 172 | 86.0% | 2 |
| 2 | MZ | Mozambique | 99 | 229 | 43.2% | 2 |
| 1 | NE | Niger | 96 | 96 | 100.0% | 1 |
| 1 | BS | Bahamas | 91 | 95 | 95.8% | 3 |
| 1 | BI | Burundi | 87 | 87 | 100.0% | 1 |
| 1 | EC | Ecuador | 86 | 140 | 61.4% | 4 |
| 1 | HT | Haiti | 79 | 103 | 76.7% | 2 |
| 1 | SL | Sierra Leone | 78 | 78 | 100.0% | 1 |
| 1 | BW | Botswana | 75 | 101 | 74.3% | 4 |
| 2 | BE | Belgium | 73 | 258 | 28.3% | 9 |
| 1 | HU | Hungary | 71 | 77 | 92.2% | 3 |
| 1 | JM | Jamaica | 71 | 103 | 68.9% | 6 |
Targeting in sanctioned and active-conflict regions
It is obvious that the demand for legitimate Western advertising in sanctioned or active-conflict states is effectively zero, so activity in these regions is worth monitoring. Our research shows that SHADOW-EARTH-79 bids in these markets despite the absence of demand, and frequently does so as the top buyer.
Table 5 shows SHADOW-EARTH-79’s rank among bidders in selected regions from this category.
| Country | Total events observed | SHADOW-EARTH-79 rank | SHADOW-EARTH-79 events | Region No. 1 buyer |
|---|---|---|---|---|
| Syria | 47 | 1 | 27 | SHADOW-EARTH-79 |
| Libya | 266 | 1 | 108 | SHADOW-EARTH-79 |
| South Sudan | 123 | 1 | 71 | SHADOW-EARTH-79 |
| Yemen | 44 | 1 | 17 | SHADOW-EARTH-79 |
| Azerbaijan | 10,346 | 1 | 7,776 | SHADOW-EARTH-79 |
| Afghanistan | 72 | 2 | 17 | BUYER3 |
Back-end infrastructure and technical analysis
TrendAI™ Research identified and reconstructed SHADOW-EARTH-79’s back-end systems using the AI-assisted analysis of recovered code and infrastructure artifacts, a relatively simple but effective technique. Many web application developers use web application frameworks such as React, Vue, and Angular, where the whole application and relevant files are packed into a bundle. The bundle is often available in an open assets folder, regardless of whether the user is currently logged in to the platform.

The examination of the JavaScript served by these systems allows us to build an understanding of what a logged-in user would see once they successfully authenticate to the system. Functions like manual script injection, de-anonymization, and other features available in the interface are consistent with a tool designed for surveillance and intelligence gathering.

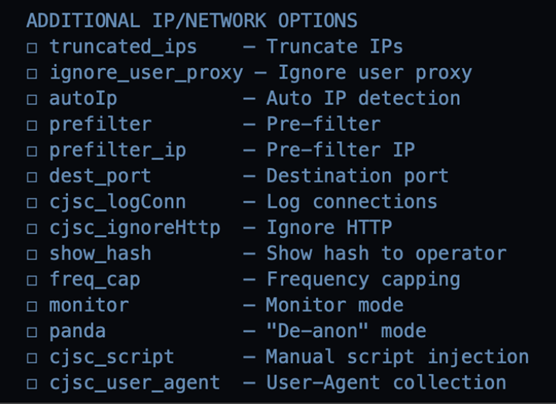
Overall, the design of this “customer-facing” front-end makes us believe that the system is more likely designed as a “surveillance” and “intelligence gathering” platform, rather than simply a platform for advertisement management.
The collected evidence indicates with moderate-to-high confidence that SHADOW-EARTH-79’s advertising presence functions as targeting and tracking infrastructure rather than a commercial advertising operation.
The anomalous bidding behavior, heavy dominance in sanctioned and conflict states, and pronounced over-bidding for Starlink address space establish intent to reach specific audiences in sensitive geographies.
Recommendations
For the advertising industry
- Investigate the activities of advertisers with similar bidding profiles to those that we have identified here and assess their legitimacy as part of the commercial advertisement ecosystem.
For governments, enterprises, and high-risk individuals
- Enable only trusted ad traffic if you must, or filter ad traffic on highly sensitive locations, and on devices belonging to likely targeted individuals.
- Staff operating in conflict zones or sanctioned states, or in any role where movement patterns are sensitive can benefit from advertising ID reset, disabling ad personalization, and limiting ad-supported app use on carried devices.
- Several mobile devices support features such as “Lockdown Mode” on iPhone; these make it harder for third parties to deliver and successfully run malicious payloads. Enabling such device modes would make surveillance operations harder.
- Use a principle of least privilege when granting access to applications on your mobile device. While the application itself may cause no harm, there is a risk coming from potentially malicious content that might be downloaded via the ad network or if an application is integrated with an ad software development kit (SDK). Many free applications use such integrations as their primary means of making a profit from the distribution of free mobile applications. Stripping third-party applications of permissions can help here, without hindering the app’s functionality.
- Look into the use of ad-blocker software, but do not rely 100% on it. If the software prevents advertisements from being shown to the user, the tracking event is likely still occurring. Instead, favor ad-blockers that have the following capabilities:
- Can intercept the web traffic and remove the ad-tag from the web content
- Can prevent ad-supported apps from reaching ad back-ends
- Can generally prevent sensitive tracking information being sent to the ad networks.
- The overall goal is risk reduction: lowering exposure without depending on identifying every bidder that might misuse it. When ad-serving infrastructure of a known suspicious operator is available (for example, SHADOW-EARTH-79), block traffic to these back-ends and cloud provider endpoints. TrendAI™ tracking of the SHADOW-EARTH-79 infrastructure is available in TrendAI Vision One™, as well as additional details with trusted contacts through established industry trust communities.